EM
Expectation-Maximization Algorithm
Gaussian Mixture distribution can be written as a linear superposition of Gaussians in the form:
\[P(\mathbf{X}) = \sum^K_{k=1} \pi_k N(\mathbf{X} | \boldsymbol{\mu}_k, \boldsymbol{\Sigma}_k)\]
Where \(\pi_k\) is the mixing coefficient for each normal component that satisfies the conditions:
\[0 \leq \pi_k \leq 1\] \[\sum^{K}_{k=1} \pi_k = 1\]
Let us introduce a \(K\)-dimensional binary latent random vector \(\mathbf{Z}\) having a 1-of-\(K\) representation in which a particular element \(Z_k \in \{0, 1\}\) is equal to 1 and all other elements are equal to 0 and \(\sum^{K}_{k=1} Z_k = 1\). We define:
The joint distribution \(P(\mathbf{X}, \mathbf{Z}) = P(\mathbf{Z}) P(\mathbf{X} | \mathbf{Z})\) in terms of a marginal distribution \(P(\mathbf{Z})\) and a conditional distribution \(P(\mathbf{X} | \mathbf{Z})\).
The marginal distribution over \(\mathbf{Z}\) is specified in terms of the mixing coefficient \(\pi_k\), such that: \[P(Z_k = 1) = \pi_k\] \[P(\mathbf{Z}) = \prod^{K}_{k=1} \pi_k^{Z_k}\]
The conditional distribution of \(\mathbf{X}\) given a particular value for \(\mathbf{Z}\) is a Gaussian: \[P(\mathbf{X} | Z_k = 1) = N(\mathbf{X} | \mu_k, \Sigma_k)\] \[P(\mathbf{X} | \mathbf{Z}) = \prod^{K}_{k=1} N(\mathbf{X} | \boldsymbol{\mu}_k, \boldsymbol{\Sigma}_k)^{Z_k}\]
The conditional probability (posterior probability) of particular value of \(\mathbf{Z}\) given a particular value for \(\mathbf{X}\), which can be found by Bayes rule: \[\gamma(Z_k) = P(Z_k = 1 | \mathbf{X}) = \frac{P(\mathbf{X} | Z_k = 1) P(Z_k = 1)}{P(\mathbf{X})} = \frac{\pi_k N(\mathbf{X} | \boldsymbol{\mu}_k, \boldsymbol{\Sigma}_k)}{\sum^K_{j=1} \pi_k N(\mathbf{X} | \boldsymbol{\mu}_j, \boldsymbol{\Sigma}_j)}\]
This probability can be viewed as the responsibility that component \(k\) takes for explaining the observation \(\mathbf{X}\)
Then the marginal distribution of the gaussian mixture can be written using the distribution of latent random vector \(\mathbf{Z}\) as:
\[P(\mathbf{X}) = \sum_{\mathbf{Z}} P(\mathbf{Z}) P(\mathbf{X} | \mathbf{Z}) = \sum^{K}_{k=1} \pi_k N(\mathbf{X} | \boldsymbol{\mu}_k, \boldsymbol{\Sigma}_k)\]
It follows that, since we are using a joint distribution, if we have a random sample \(\mathbf{X}_1, ..., \mathbf{X}_N\), for every random vector \(\mathbf{X}_n\) there is a corresponding latent variable \(\mathbf{Z}_n\). Therefore, we have found an equivalent formulation of the Gaussian mixture involving an explicit latent variable. Now, we can work with the joint distribution \(P(\mathbf{X}, \mathbf{Z})\) instead of the original marginal distribution \(P(\mathbf{X})\).
We can express the joint distribution as Bayesian network:

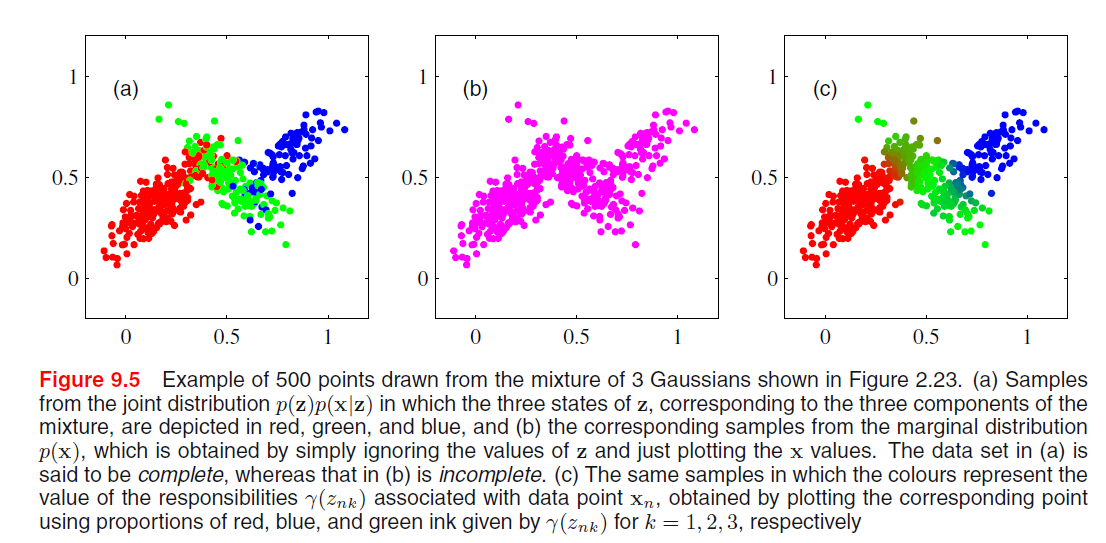
And we can use ancestral sampling to generate random samples distributed according to the Gaussian mixture model:
- Sample from \(\hat{\mathbf{Z}} \sim P(\mathbf{Z})\)
- Sample from \(P(\mathbf{X} | \hat{\mathbf{Z}})\)
- Coloring them by the \(\mathbf{\hat{Z}}\)

EM for Gaussian Mixtures
Suppose we have a dataset of observations \(\{\mathbf{x}_1, ...., \mathbf{x}_N; \; \mathbf{x} \in \mathbb{R}^M\}\), and we wish to model this data using a mixture of Gaussians. We can represent this dataset as an \(N \times M\) matrix \(\mathbf{D}\) in which the \(n\)th row is given by \(\mathbf{x}^T_n\). Similarly, the corresponding latent variables will be denoted by an \(N \times K\) matrix \(\mathbf{H}\) with rows \(\mathbf{Z}^T_n\). If we assume that the data points are drawn independently from the distribution then we can express the Gaussian mixture model for this i.i.d dataset using the graphical representation:

The log-likelihood function is given by:
\[\ln(P(\mathbf{D} | \boldsymbol{\pi}, \boldsymbol{\mu}, \boldsymbol{\Sigma})) = \sum^{N}_{n=1} \ln (\sum^K_{k=1} \pi_k N(\mathbf{x}_n | \boldsymbol{\mu}_k, \boldsymbol{\Sigma}_k))\]
An elegant and powerful method for finding maximum likelihood solutions for models with latent variables is called the expectation-maximization algorithm.
We know that at a maximum of the likelihood function (by taking the derivative with respect to \(\mathbf{\mu}_k\)):
\[0 = - \sum^N_{n=1} \underbrace{\frac{\pi_k N(\mathbf{x}_n | \boldsymbol{\mu}_k, \boldsymbol{\Sigma}_k)}{\sum^K_{j=1} \pi_k N(\mathbf{x}_n | \boldsymbol{\mu}_j, \boldsymbol{\Sigma}_j)}}_{\gamma(Z_{nk})} \boldsymbol{\Sigma}_k (\mathbf{x}_n - \boldsymbol{\mu}_k)\]
By assuming that \(\boldsymbol{\Sigma}_k\) is invertible and rearranging we have:
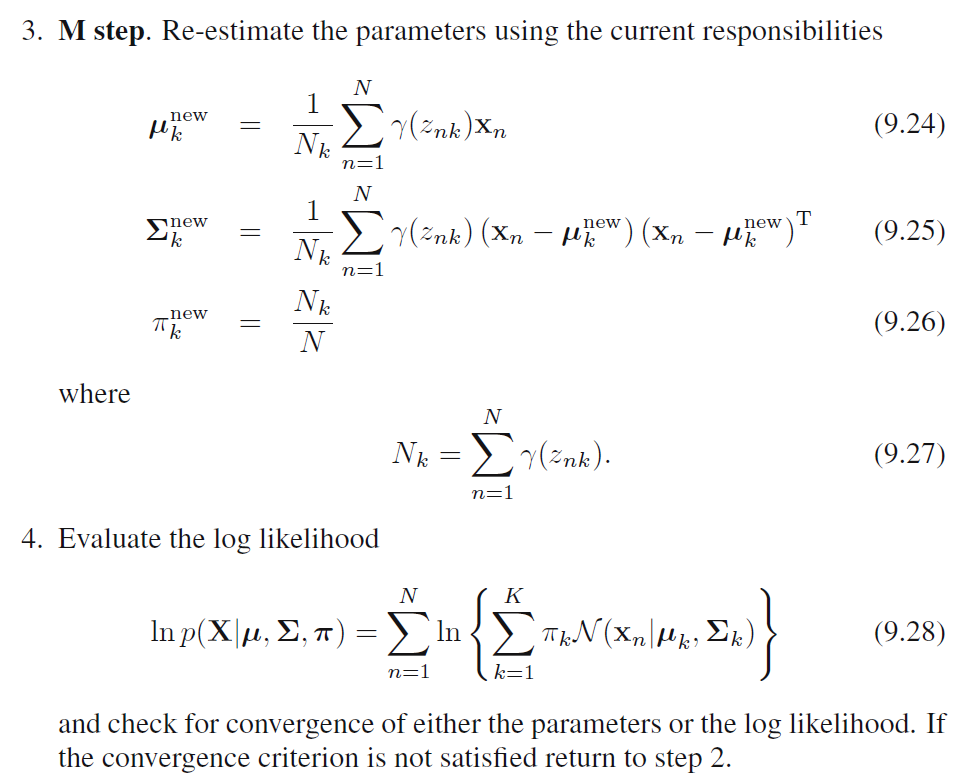
\[\boldsymbol{\hat{\mu}}_k = \frac{1}{N_k} \sum^N_{n=1} \gamma(Z_{nk}) \mathbf{x}_n\]
\[N_k = \sum^N_{n=1} \gamma(Z_{nk})\]
Since \(Z_{nk} = P(Z_{nk} = 1 | \mathbf{X} = \mathbf{x}_n)\) is the posterior probability, we can interpret \(N_k\) as the total probability of samples assigned to cluster \(k\). We can see that the mean \(\boldsymbol{\mu}_k\) for the \(k\)th Gaussian component is obtained by taking a mean of all of the points in the dataset weighted by the posterior distribution for cluster \(k\).
By taking the derivative w.r.t \(\boldsymbol{\Sigma}_k\), we have:
\[\boldsymbol{\hat{\Sigma}}_k = \frac{1}{N_k} \sum^N_{n=1} \gamma(Z_{nk}) (\mathbf{x}_n - \boldsymbol{\mu}_n)(\mathbf{x}_n - \boldsymbol{\mu}_n)^T\]
By taking the derivative w.r.t the miximing coefficients \(\pi_k\) and using lagrange multiplier, we have:
\[\hat{\pi}_k = \frac{N_k}{N}\]
So that the mixing coefficient for the \(k\)th component is given by the average responsibility which that component takes for explaining the data points.
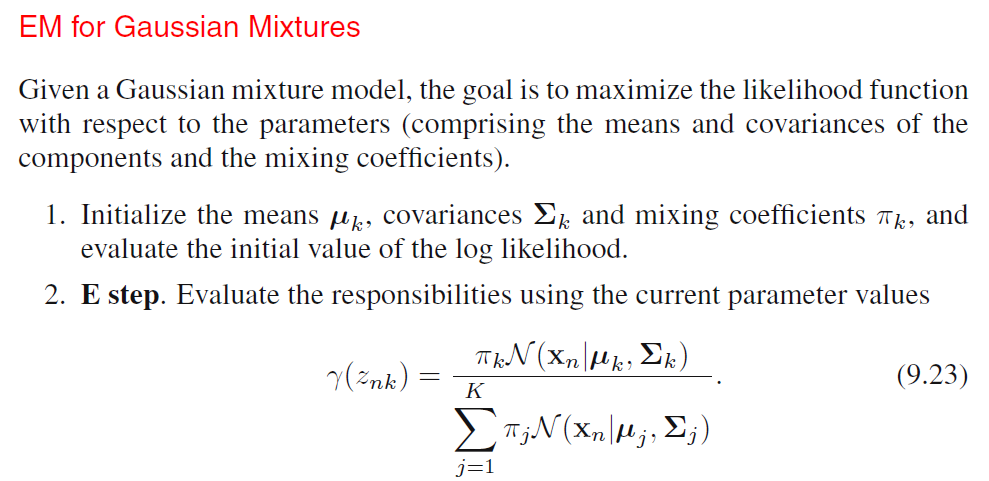
We can see that, \(\hat{\pi}_k, N_k, \boldsymbol{\hat{\mu}}_k, \boldsymbol{\hat{\Sigma}}_k\) all depends on the value of \(\gamma(Z_{nk})\) and \(\gamma(Z_{nk})\) depends on the values of all other variables. Thus, we can do a simple iterative scheme for finding a solution to the maximum likelihood problem, which turns out to be an instance of the EM algorithm for the particular case of Gaussian Mixture Model:
- We first choose some initial values for the means, covariances and mixing coefficients.
- We alternate between E step and M step:
- Expectation Step: We use the current values for the parameters to evaluate the posterior probabilities (responsibilities).
- Maximization Step: We then use responsibilities to maximize the log likelihood function for parameters (Mean first, then covariance matrix).
In practice, the algorithm is deemed to have converged when the change in the log likelihood function or alternatively in the parameters falls below some threshold.


An Alternative View of EM
The goal of EM Algorithm is to find maximum likelihood solutions for models having latent variables. We denote sthe set of all observed data by \(\mathbf{D}\) in which the \(n\)th row represents \(\mathbf{x}^T_n\), and similarily we denote the set of all latent variables by \(\mathbf{H}\) with a corresponding row \(\mathbf{Z}^T_n\). The set of all parameters is denoted by \(\boldsymbol{\theta}\) and so the log likelihood function is given by:
\[\ln L(\boldsymbol{\theta}; \; \mathbf{D}) = \ln(\sum_{\mathbf{H}} P(\mathbf{D}, \mathbf{H} | \boldsymbol{\theta}))\]
If we have continuous latent variable, we can replace the summation by integral.
A key observation is that the summation over the latent variables appears inside the logarithm which provides much complicated expression of log likelihood. Suppose, for each observation in \(\mathbf{D}\), we have observed corresponding random variable \(\mathbf{Z}^T_n = \mathbf{z}^T_n\). We call \(\{\mathbf{D}, \mathbf{H}\}\) the complete dataset and if we only observed \(\mathbf{D}\) we have incomplete dataset, the maximization of this complete-data log likelihood function is straightforward and much simpler than incomplete likelihood.
In practice, we are not given the complete dataset but only the incomplete data. Our state of knowledge of the values of the latent variables in \(\mathbf{H}\) is given only by the posterior distribution:
\[P(\mathbf{H} | \mathbf{D}, \boldsymbol{\theta}) = \frac{P(\mathbf{H}, \mathbf{D} | \boldsymbol{\theta})}{P(\mathbf{D} | \boldsymbol{\theta})}\]
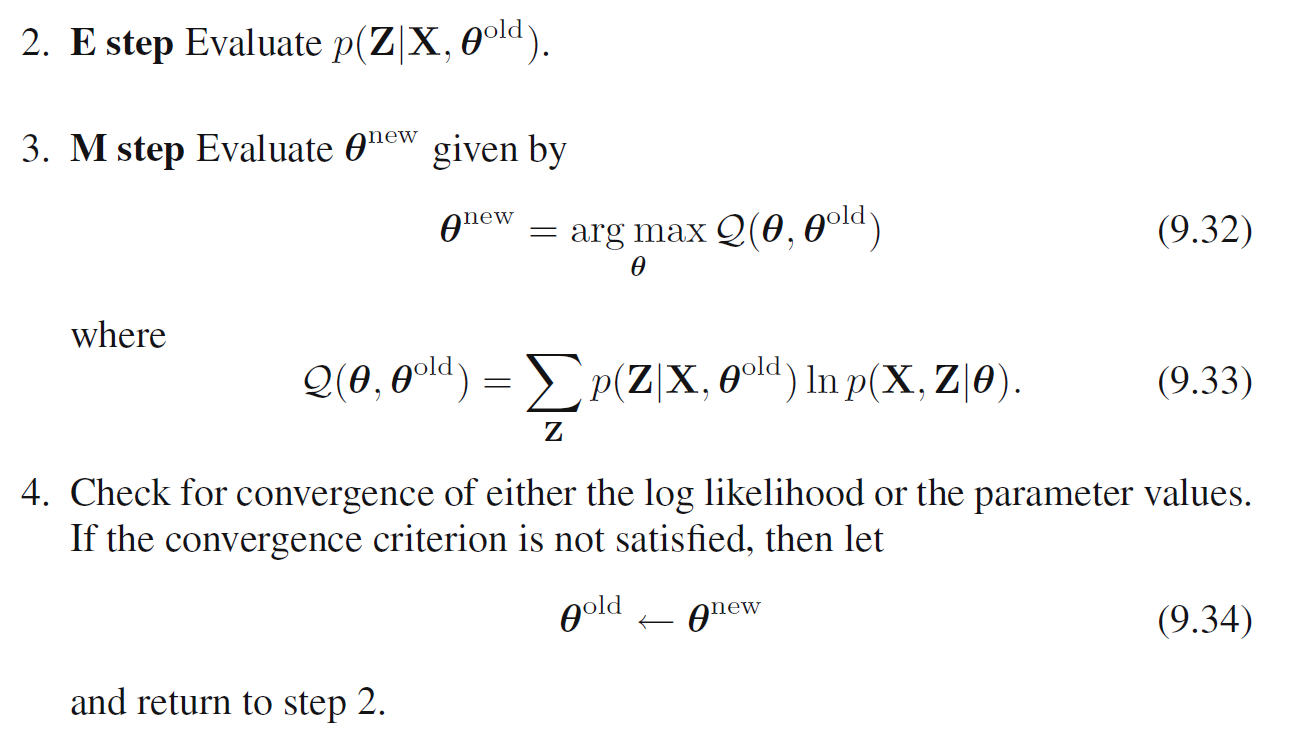
Since we cannot use the complete dataset log likelihood, we can consider using the expectation under the posterior distribution (E step). In E step, we use the current parameter values \(\boldsymbol{\theta}^{old}\) to find the posterior distribution of the latent variables given by \(P(\mathbf{H} | \mathbf{D}, \boldsymbol{\theta})\). We then use this posterior distribution to find the expectation of the complete-data log likelihood evaluated for some general parameter value \(\boldsymbol{\theta}\). This expectation, denoted as:
\[Q(\boldsymbol{\theta}, \boldsymbol{\theta}^{old}) = E_{\mathbf{H} | \mathbf{D}, \boldsymbol{\theta}^{old}} [\ln P(\mathbf{D}, \mathbf{H} | \boldsymbol{\theta})] = \sum_{\mathbf{H}} P(\mathbf{H} | \mathbf{D}, \boldsymbol{\theta}^{old}) \ln P(\mathbf{D}, \mathbf{H} | \boldsymbol{\theta})\]
In the subsequent M step, we find parameters that maximize this expectation. If the current estimate for the parameters is denoted \(\boldsymbol{\theta}^{old}\), then a pair of successive E and M steps gives rise to a revised estimate \(\boldsymbol{\theta}^{new}\). The algorithm is initialized by choosing some starting value for the parameters \(\boldsymbol{\theta}_0\).
\[\theta^{new} = \underset{\boldsymbol{\theta}}{\arg\max} \; Q(\boldsymbol{\theta}, \boldsymbol{\theta}^{old})\]
Notice here we have complete data log likelihood, compare it with incomplete data log likelihood, the log likelihood function is much easier to compute.
General EM algorithm


General EM Algorithm for Gaussian Mixture
Previously, we used incomplete data log likelihood for Gaussian Mixture together with the EM algorithm, we have summation over \(k\) over \(k\) that occurs inside the logarithm. Now, we try to use general approach of EM algorithm.
We have the complete data likelihood:
\[\begin{aligned} P(\mathbf{D}, \mathbf{H} | \boldsymbol{\mu}, \boldsymbol{\Sigma}, \boldsymbol{\pi}) &= P(\mathbf{D} | \mathbf{H}, \boldsymbol{\mu}, \boldsymbol{\Sigma}, \boldsymbol{\pi}) P(\mathbf{H} | \boldsymbol{\mu}, \boldsymbol{\Sigma}, \boldsymbol{\pi})\\ &= \prod^{N}_{n=1}\prod^{K}_{k=1}\pi_k^{Z_{nk}} N(\mathbf{x}_n | \boldsymbol{\mu}_k, \boldsymbol{\Sigma}_k)^{Z_{nk}}\\ \end{aligned}\]Where \(Z_{nk}\) is the \(k\) the component of \(\mathbf{Z}_n\). Taking the logarithm, we have the log likelihood:
\[\ln P(\mathbf{D}, \mathbf{H} | \boldsymbol{\mu}, \boldsymbol{\Sigma}, \boldsymbol{\pi}) = \sum^{N}_{n=1}\sum^{K}_{k=1} Z_{nk} (\ln \pi_k + \ln N(\mathbf{x}_n | \boldsymbol{\mu}_k, \boldsymbol{\Sigma}_k))\]
Compare with the incomplete data log likelihood, we can see that this form is much easier to solve. In practice, we do not obtain the values of \(\mathbf{H}\), thus, we use expectation instead:
\[\begin{aligned} E_{\mathbf{H} | \boldsymbol{\mu}} [\ln P(\mathbf{D}, \mathbf{H} | \boldsymbol{\mu}, \boldsymbol{\Sigma}, \boldsymbol{\pi})] &= \sum^{N}_{n=1}\sum^{K}_{k=1} P(Z_{nk}=1 | \mathbf{D}, \boldsymbol{\mu}, \boldsymbol{\Sigma}, \boldsymbol{\pi}) (\ln \pi_k + \ln N(\mathbf{x}_n | \boldsymbol{\mu}_k, \boldsymbol{\Sigma}_k))\\ &= \sum^{N}_{n=1}\sum^{K}_{k=1} \gamma(Z_{nk}) (\ln \pi_k + \ln N(\mathbf{x}_n | \boldsymbol{\mu}_k, \boldsymbol{\Sigma}_k)) \end{aligned}\]We then proceed as follows:
- First we start at some initial values for parameters.
- We use these parameters to evaluate the responsibilities.
- We then maximize the expected log likelihood function.
Which is the same as the incomplete data log likelihood EM previously, but we have a much easier log likelihood function to maximize over.
Ref
PRML Chapter 9